
Sports Betting Research: What Actually Predicts Winners
 Available in US
Learn how to conduct effective sports betting research to identify predictive factors and find a genuine edge against the sportsbooks.

Most bettors think they’re doing effective sports betting research. They check injury reports, glance at team records, maybe read a few articles, and call it analysis. That’s not research. That’s consuming information everyone else already has, information that’s completely priced into the betting lines. Real research means finding insights the market doesn’t have or doesn’t properly value. It means understanding which factors actually predict outcomes versus which factors just feel like they should matter but don’t.
The hardest part about research is that 90% of what’s publicly available is either useless or already incorporated into odds. Box score statistics, win-loss records, basic injury information the sportsbooks know all this. The professional bettors know all this. The line you’re looking at already reflects this information. If you want an edge, you need to go deeper or look at things differently than the consensus.
This doesn’t mean you need proprietary data or insider connections. It means understanding what genuinely predicts performance and what’s just noise. It means knowing which statistics are stable versus which ones fluctuate wildly with luck. It means recognizing when the market overreacts or underreacts to information. Most importantly, it means having a systematic process for evaluating games rather than just going with your gut.
Table of Contents
The Problem with Surface-Level Statistics
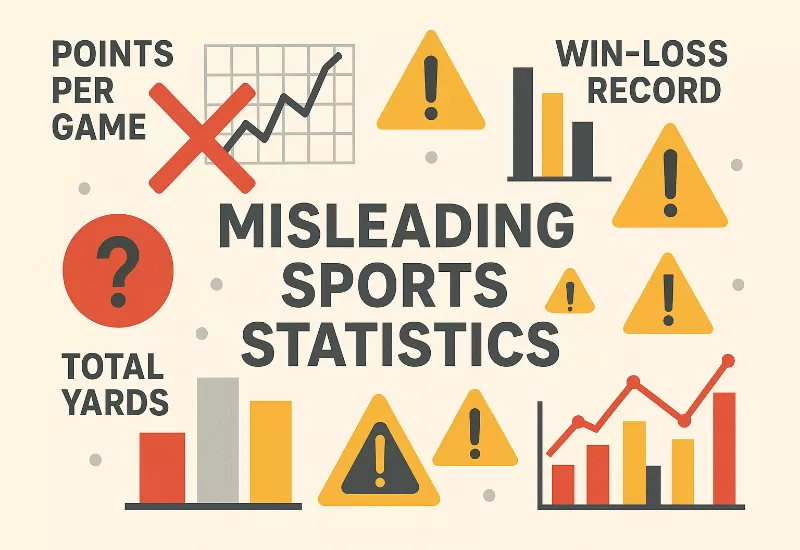
Points per game is one of the most commonly cited statistics in sports betting. It’s also one of the least useful for predicting future performance. A team averaging 28 points per game sounds impressive until you realize they played the five worst defenses in the league and their offense is actually mediocre when adjusted for opponent strength.
Total offense and total defense rankings suffer from the same problem. They don’t account for pace of play, strength of schedule, or game context. A team that plays slow and controls possession will have lower total yards than a team that plays fast, even if they’re equally effective per possession. A defense that always plays with a lead faces different situations than a defense that’s usually trailing. The raw numbers are misleading without context.
Win-loss records are obviously the ultimate outcome, but they’re terrible predictors of future performance over small samples. Teams get lucky. They win close games they could easily have lost. They face easy schedules. A 7-2 team isn’t necessarily better than a 5-4 team if the 7-2 team has played cupcakes and won several games by fluky plays while the 5-4 team has played a brutal schedule and lost close games to quality opponents.
The market adjusts for records because the public bets based on records. When Team A is 8-1 and Team B is 3-6, the public assumes Team A is way better and bets accordingly. The line reflects this public perception, which creates opportunities when the records don’t actually indicate the true quality gap between teams. Sometimes the 3-6 team is better than their record suggests and provides value as an underdog.
Season-long averages also mask trends within the season. A team might average 350 yards per game, but if they averaged 400 in their first five games and 300 in their last five, that downward trajectory matters. Using season-long averages treats all games equally when recent performance is often more predictive of current team quality. You need to look at splits and trends, not just aggregates.
Individual player statistics can be even more misleading. A quarterback might have great passing yards but terrible efficiency. A running back might have lots of carries but poor yards per carry. A receiver might have lots of catches but mostly on short passes with no yards after catch. Counting stats look impressive but don’t necessarily indicate quality performance. You need to understand the context behind the numbers.
The biggest mistake casual bettors make is stopping their research at easily accessible statistics. They look up the numbers, form an opinion, and bet. But everyone has access to the same easily accessible statistics. The market has priced them in. If you’re basing decisions on information everyone knows, you’re not getting an edge. You’re just betting on vibes informed by public data.
Efficiency Metrics That Actually Matter
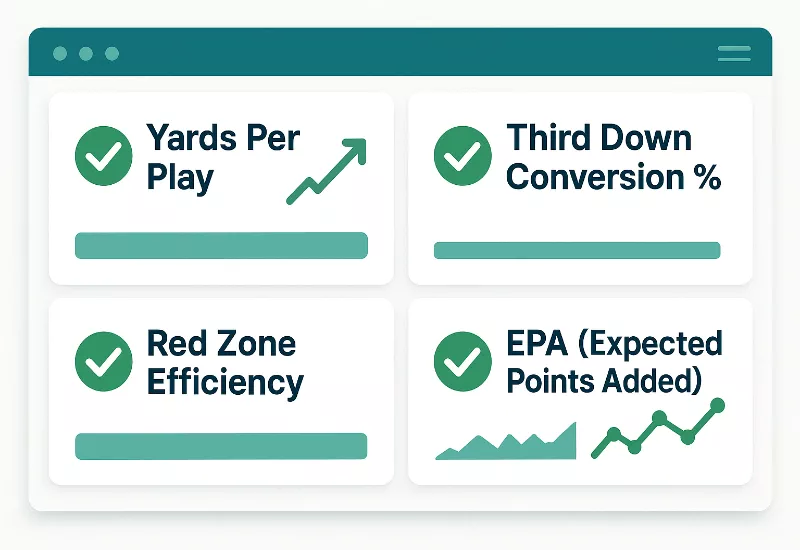
Yards per play is dramatically more predictive than total yards because it accounts for efficiency rather than volume. A team that gains 350 yards on 55 plays is significantly better than a team that gains 400 yards on 80 plays, even though the total yards favor the second team. The first team is more efficient, which matters more for sustainable performance.
For offense, yards per play captures how effective a team is at moving the ball regardless of how many possessions they have. Some teams run lots of plays because they play fast. Some run fewer because they control clock. What matters is whether they’re actually good at gaining yards when they have the ball. Yards per play tells you that in a way total yards doesn’t.
Defensively, yards per play allowed is equally important. A defense that gives up 5.0 yards per play is significantly worse than one that gives up 4.5 yards per play, and that difference compounds over an entire game. Small per-play advantages become large advantages over 60 or 70 plays. This is why efficiency metrics are more stable and predictive than volume metrics.
Third down conversion rate is another efficiency metric that matters enormously. Teams that convert third downs sustain drives, control possession, and wear down opposing defenses. Teams that stop third downs get off the field and limit opponent opportunities. Third down performance is more stable over time than many other statistics and provides genuine insight into team quality that isn’t always fully priced into lines.
Red zone efficiency separates good teams from lucky teams. Scoring touchdowns instead of settling for field goals inside the 20-yard line is crucial for sustainable offensive success. A team that scores lots of points but struggles in the red zone is probably getting lucky with big plays and will regress. A team with great red zone efficiency is doing something real that will continue.
Turnover margin is important but highly volatile. Teams that have positive turnover differentials tend to win more, obviously, but turnover creation and avoidance involve significant luck. A defense that forces fumbles is doing something repeatable. A defense that recovers a high percentage of fumbles is getting lucky, because fumble recoveries are roughly 50-50. You need to separate skill from luck when evaluating turnover-dependent performance.
Expected points added and success rate are advanced metrics that adjust for context in ways basic statistics don’t. A five-yard gain on third-and-four is vastly more valuable than a five-yard gain on first-and-ten, but traditional stats treat them identically. EPA accounts for the situational value of each play, providing a more accurate picture of team performance than yards or points alone.
These efficiency metrics aren’t secrets. They’re publicly available, often for free. What separates sharps from squares isn’t having access to these numbers. It’s actually using them systematically to evaluate games instead of relying on the surface-level stats that confirm existing biases.
Matchup-Specific Analysis
General team strength matters, but specific matchups matter more. A great offense can struggle against a defense specifically designed to stop what they do best. A weak defense can stifle an offense that doesn’t match up well stylistically. Understanding how teams match up against each other is where edges exist.
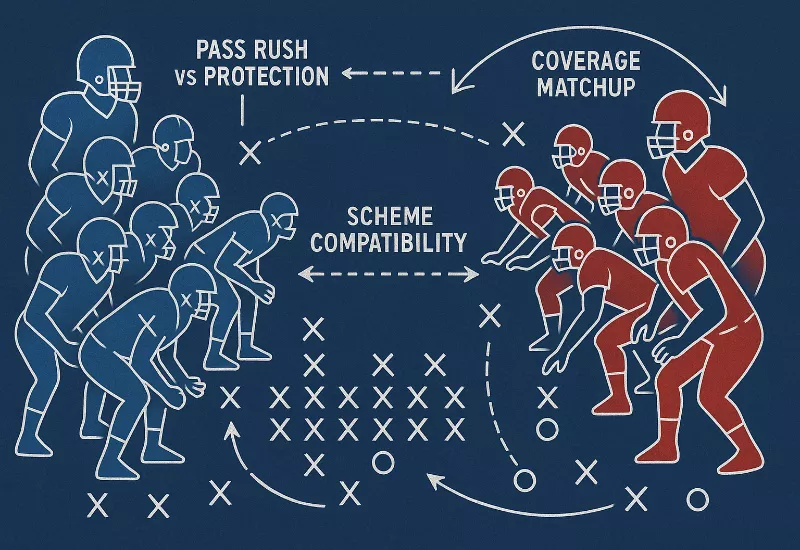
Offensive and defensive scheme compatibility is crucial. A zone defense struggles against offenses that run effective zone-beating route combinations. A man defense struggles against offenses with speed advantages at skill positions. If you know Team A runs a zone-heavy defense and Team B’s offense is specifically built to attack zones, that’s valuable information that might not show up in overall team statistics.
Pass rush versus pass protection creates exploitable matchups. A dominant pass rush against a weak offensive line means the quarterback will be under pressure all game, which affects everything the offense does. Conversely, a great offensive line against a weak pass rush means the quarterback has time, which allows the offense to execute their full playbook. These line matchups determine game flow in ways that aren’t always reflected in spread pricing.
Run defense versus run offense is similarly important, especially in certain game contexts. If one team wants to control clock and run the ball, but they’re facing a defense that’s specifically good against the run, that’s a problem for their entire game plan. The market adjusts for general offensive and defensive strength, but it doesn’t always properly price specific stylistic advantages.
Coverage matchups at receiver are worth analyzing for both sides and totals. If a team’s best receiver will be covered by a weak cornerback all game, that’s a significant advantage. If a team’s weak cornerback will be targeted repeatedly by a quality passing offense, that’s a problem. These individual matchups can swing games and create prop betting opportunities when the market hasn’t fully adjusted.
Special teams matchups are almost completely ignored by casual bettors but matter in close games. A great punt coverage unit versus a dangerous return man creates field position advantages. A great field goal kicker in a dome has more value than a mediocre kicker in windy conditions. In games expected to be close, special teams advantages can be the difference between covering and not covering.
Historical head-to-head results should be used cautiously. The fact that Team A beat Team B last year doesn’t necessarily predict this year’s game if rosters and coaching have changed significantly. But sometimes there are legitimate stylistic reasons why one team consistently matches up well against another, and those can persist across seasons if the core personnel and schemes remain similar.
Weather and environmental factors create matchup considerations beyond just team quality. A dome team traveling to play outdoors in cold weather faces disadvantages in comfort and preparation. A pass-heavy offense playing in heavy wind loses its primary advantage. These situational matchups aren’t always fully priced in, especially when the weather forecast changes close to game time.
Understanding What’s Already Priced In
The biggest mistake in sports betting research is finding information and assuming it gives you an edge without considering whether the market already knows it. Recent team performance, major injuries, historical trends all of this is public information that sophisticated bettors and sportsbooks are aware of. The line already reflects it.
When a starting quarterback is ruled out, the line moves immediately and dramatically. By the time you hear about it and think about betting the backup, the value is gone. The market has already adjusted. In fact, it’s probably overadjusted because the public overreacts to big-name injuries. The actual betting opportunity might be on the team with the injured star, not against them, because the line movement was excessive.
Home field advantage is worth approximately 2.5 points in most sports, and this is baked into every line. You don’t get an edge by identifying that the home team has an advantage. Everyone knows that. The market has priced it. Where you might find an edge is identifying specific situations where home field is worth more or less than the standard adjustment certain stadiums with unique advantages, certain opponents that travel particularly poorly, certain times of season when weather amplifies home field.
Trends and systems are mostly worthless because they’re backward-looking pattern recognition in noisy data. You’ll see things like “teams off a bye week are 65% ATS in divisional games” and bettors treat this as predictive. But is it actually causal, or is it just random variation over a limited sample? Even if it was real historically, does the market now price it in, eliminating the edge? Most trends that get publicized quickly get arbitraged away.
Media narratives become priced in as soon as they become consensus. When everyone is talking about how Team A is hot and Team B is in turmoil, the betting market reflects that narrative. You’re not getting value betting on the hot team because the market has already moved the line to account for public perception. Often the value is fading the narrative and betting the opposite of what feels obvious. Once you have gathered the right data, the next step is learning exactly how to find value bets that offer a genuine edge over the bookmakers.
Scheduling spots like Thursday night games, cross-country travel, division rematches the market knows about all of this. The line adjusts for these factors. You might still find value in these spots, but only if your assessment of how much the scheduling matters differs from the market’s assessment. Simply identifying that a scheduling spot exists doesn’t give you an edge.
Sharp money shows up in line movements. When a line moves against the public betting percentages, that’s usually sharp bettors taking the other side. This information is valuable, but it’s also public. Everyone can see line movements and betting percentages. By the time you notice the sharp money and decide to follow it, the value might be reduced or gone. You need to be early or have conviction independent of following sharps.
The question you should ask with any piece of research isn’t “is this information true?” It’s “does the market already know this, and if so, has it properly adjusted for it?” Often the answer is yes and yes, which means the information provides no betting edge even though it’s factually accurate and relevant to the game.

Situational Factors and Motivation
Certain game situations create predictable advantages that the market doesn’t always price correctly. Teams fighting for playoff spots in must-win games sometimes play above their talent level. Teams that have locked up playoff seeding might not be fully motivated in meaningless late-season games. The challenge is identifying when these situations actually matter versus when they’re just narratives.
Lookahead spots are real but overrated. The theory is that a team with a tough opponent next week might overlook this week’s easier opponent. This occasionally happens, but not as often as bettors think. Professional teams are generally too disciplined and coaches are too paranoid about trap games for this to be a systematic edge. When everyone is talking about a lookahead spot, it’s already priced in.
Letdown spots after big wins are more legitimate. Teams that just won an emotional rivalry game or pulled off a huge upset sometimes come out flat the following week. The emotional high can’t sustain indefinitely, and human nature is to relax after achieving something significant. This doesn’t mean you blindly bet against teams coming off big wins, but it’s worth considering in your analysis.
Revenge games get too much attention from casual bettors. The market overprices revenge motivation because the public loves these narratives. A team playing an opponent that beat them badly last year might be motivated, but that motivation is already reflected in the line, probably excessively. More often, revenge game angles are worth fading rather than backing.
Playoff implications create legitimate motivation differentials late in season. A team that needs to win to stay in playoff contention is playing with urgency that a team with nothing to play for doesn’t have. The market adjusts for this, but sometimes not enough, especially in situations where the playoff implications aren’t obvious to casual observers. Deep research into standings, tiebreakers, and remaining schedules can identify motivation edges.
Rest advantages from bye weeks or extra days off provide measurable benefits, especially for injury recovery and game preparation. Teams off bye weeks historically perform well, though this is widely known and priced in. What’s less obvious is the cumulative effect of schedule congestion. A team playing their third game in eleven days is at a legitimate disadvantage against a team that’s well-rested, even if neither team had a formal bye.
Coach and player contract situations rarely matter as much as bettors think. The idea that a coach on the hot seat will somehow make his team play harder is mostly fantasy. Professional athletes are always trying to win. A coach’s job security doesn’t materially change on-field performance in most cases. Similarly, players in contract years supposedly play better, but research doesn’t really support this. Motivation narratives feel compelling but usually don’t predict outcomes.
Weather expectations can create value when forecasts change. If the forecast calls for heavy wind and the total gets adjusted down, but then the forecast improves and the game is actually played in decent conditions, there might be value on the over. The market moved based on the forecast but couldn’t readjust quickly enough when conditions changed. This requires monitoring weather closely up until game time.
Building a Systematic Research Process
Having random research insights is useful but insufficient. You need a consistent, repeatable process for evaluating games that you follow regardless of how you feel or what your gut says. This prevents cognitive biases from hijacking your analysis and ensures you’re evaluating all relevant factors systematically.
Start with a checklist of factors you assess for every game. This might include efficiency metrics, matchup advantages, situational spots, injury impacts, and whatever else you’ve identified as predictive. The specific items on the checklist matter less than having a checklist at all. It forces you to consider all relevant factors instead of just the ones that support your initial inclination.
Quantifying factors helps remove subjectivity. Instead of noting that Team A has a “good” offense, calculate their yards per play and compare it to their opponent’s yards per play allowed. Instead of saying the matchup “favors” one team, identify by how much and in which specific areas. Numbers aren’t perfect, but they’re less susceptible to bias than qualitative assessments.
Time allocation matters in research. You can’t spend four hours researching every game. You need to triage and focus your efforts on games where you’re most likely to find edges. This means quickly identifying games that don’t offer value and spending your research time on spots where you have conviction or uncertainty. Efficiency in research allows you to cover more games without burning out.
Developing specialization improves research quality. Instead of trying to research every sport and every league, focus on one area where you can develop genuine expertise. The more you know about a specific sport, the better your pattern recognition becomes. You’ll start noticing things casual observers miss because you’ve seen thousands of games and understand what actually matters.
Tracking research results helps refine your process. Did the factors you thought were important actually predict outcomes? Are certain types of analysis consistently producing value while others aren’t? You can only know this if you’re documenting your reasoning for each bet and later analyzing which reasoning was correct. This feedback loop is essential for improving over time.
Automating what you can saves time for analysis that requires judgment. If you’re calculating efficiency metrics manually every week, that’s time you could spend on matchup analysis. Use spreadsheets or tools to handle the quantitative grunt work so you can focus on qualitative evaluation where human insight still provides edge.
Staying current with league changes matters because what worked last year might not work this year. Rules changes, scheme trends, officiating emphases all of these affect which factors are predictive. A research process that doesn’t adapt to changing environments will gradually lose its edge as the market evolves.

What Doesn’t Actually Matter
Part of good research is knowing what to ignore. Bettors waste enormous time analyzing factors that feel important but have no real predictive value. This isn’t obvious, because sports narratives constantly emphasize things that sound meaningful but aren’t.
Uniforms and jersey combinations have zero predictive value but receive surprising attention. Teams don’t perform differently because they’re wearing alternate jerseys. This is pure superstition, yet you’ll see bettors reference uniform records as if they matter. They don’t. Any correlations are random noise.
Anniversary dates and symbolic milestones rarely affect performance. A team playing on the anniversary of a legendary player’s death doesn’t play better because of emotional inspiration. These narratives are media constructs, not performance predictors. Professional athletes are focused on winning the game in front of them, not honoring abstract concepts.
Coach vs former team storylines are overrated. The public gets excited when a coach faces his old team, assuming extra motivation or insider knowledge. But coaches face their former teams regularly and results are random. The market overprices these narratives because the public overweights them, which sometimes creates value on the other side.
Hot and cold streaks are mostly meaningless over small samples. A player who has scored in five straight games isn’t more likely to score in the sixth game because of the streak. Each game is independent, and regression to mean is real. The market knows this, but the public bets on hot players and hot teams anyway, creating inefficiencies.
Media coverage intensity doesn’t predict outcomes. A game getting heavy national media attention isn’t inherently different from a game that isn’t. Teams don’t play better or worse because ESPN is talking about them. If anything, heavy media attention sometimes correlates with overvalued favorites because the public bets more on games they hear about.
Divisional familiarity is real but overblown. Teams do play division opponents twice a year and know each other well, but this doesn’t systematically favor underdogs or favorites. Some bettors swear by divisional betting angles, but when you actually track the data, the edges disappear or are already priced in.
Resting starters late in season matters but is usually obvious. When teams have nothing to play for and rest their stars, the market knows immediately and the line adjusts dramatically. By the time you hear about starters being rested, the value is gone. Occasionally you can anticipate rest decisions before they’re announced, but that requires deep knowledge of the team’s situation.
The key to efficient research is developing pattern recognition for which factors actually matter versus which just feel like they should matter. Most of what casual bettors spend time researching falls into the second category. Focus your efforts on the factors with genuine predictive value and ignore the rest, no matter how compelling the narrative sounds.
Explore the best sports betting strategy guide to discover more ways to beat the odds.
